help
The studio is where images become line art. The left pane loads and tunes the image, the middle shows the render, and the right pane handles pens and exports. Every control in the app has a tooltip: hover it, or long-press on a touch screen, for a hint in place. This page is the longer version.
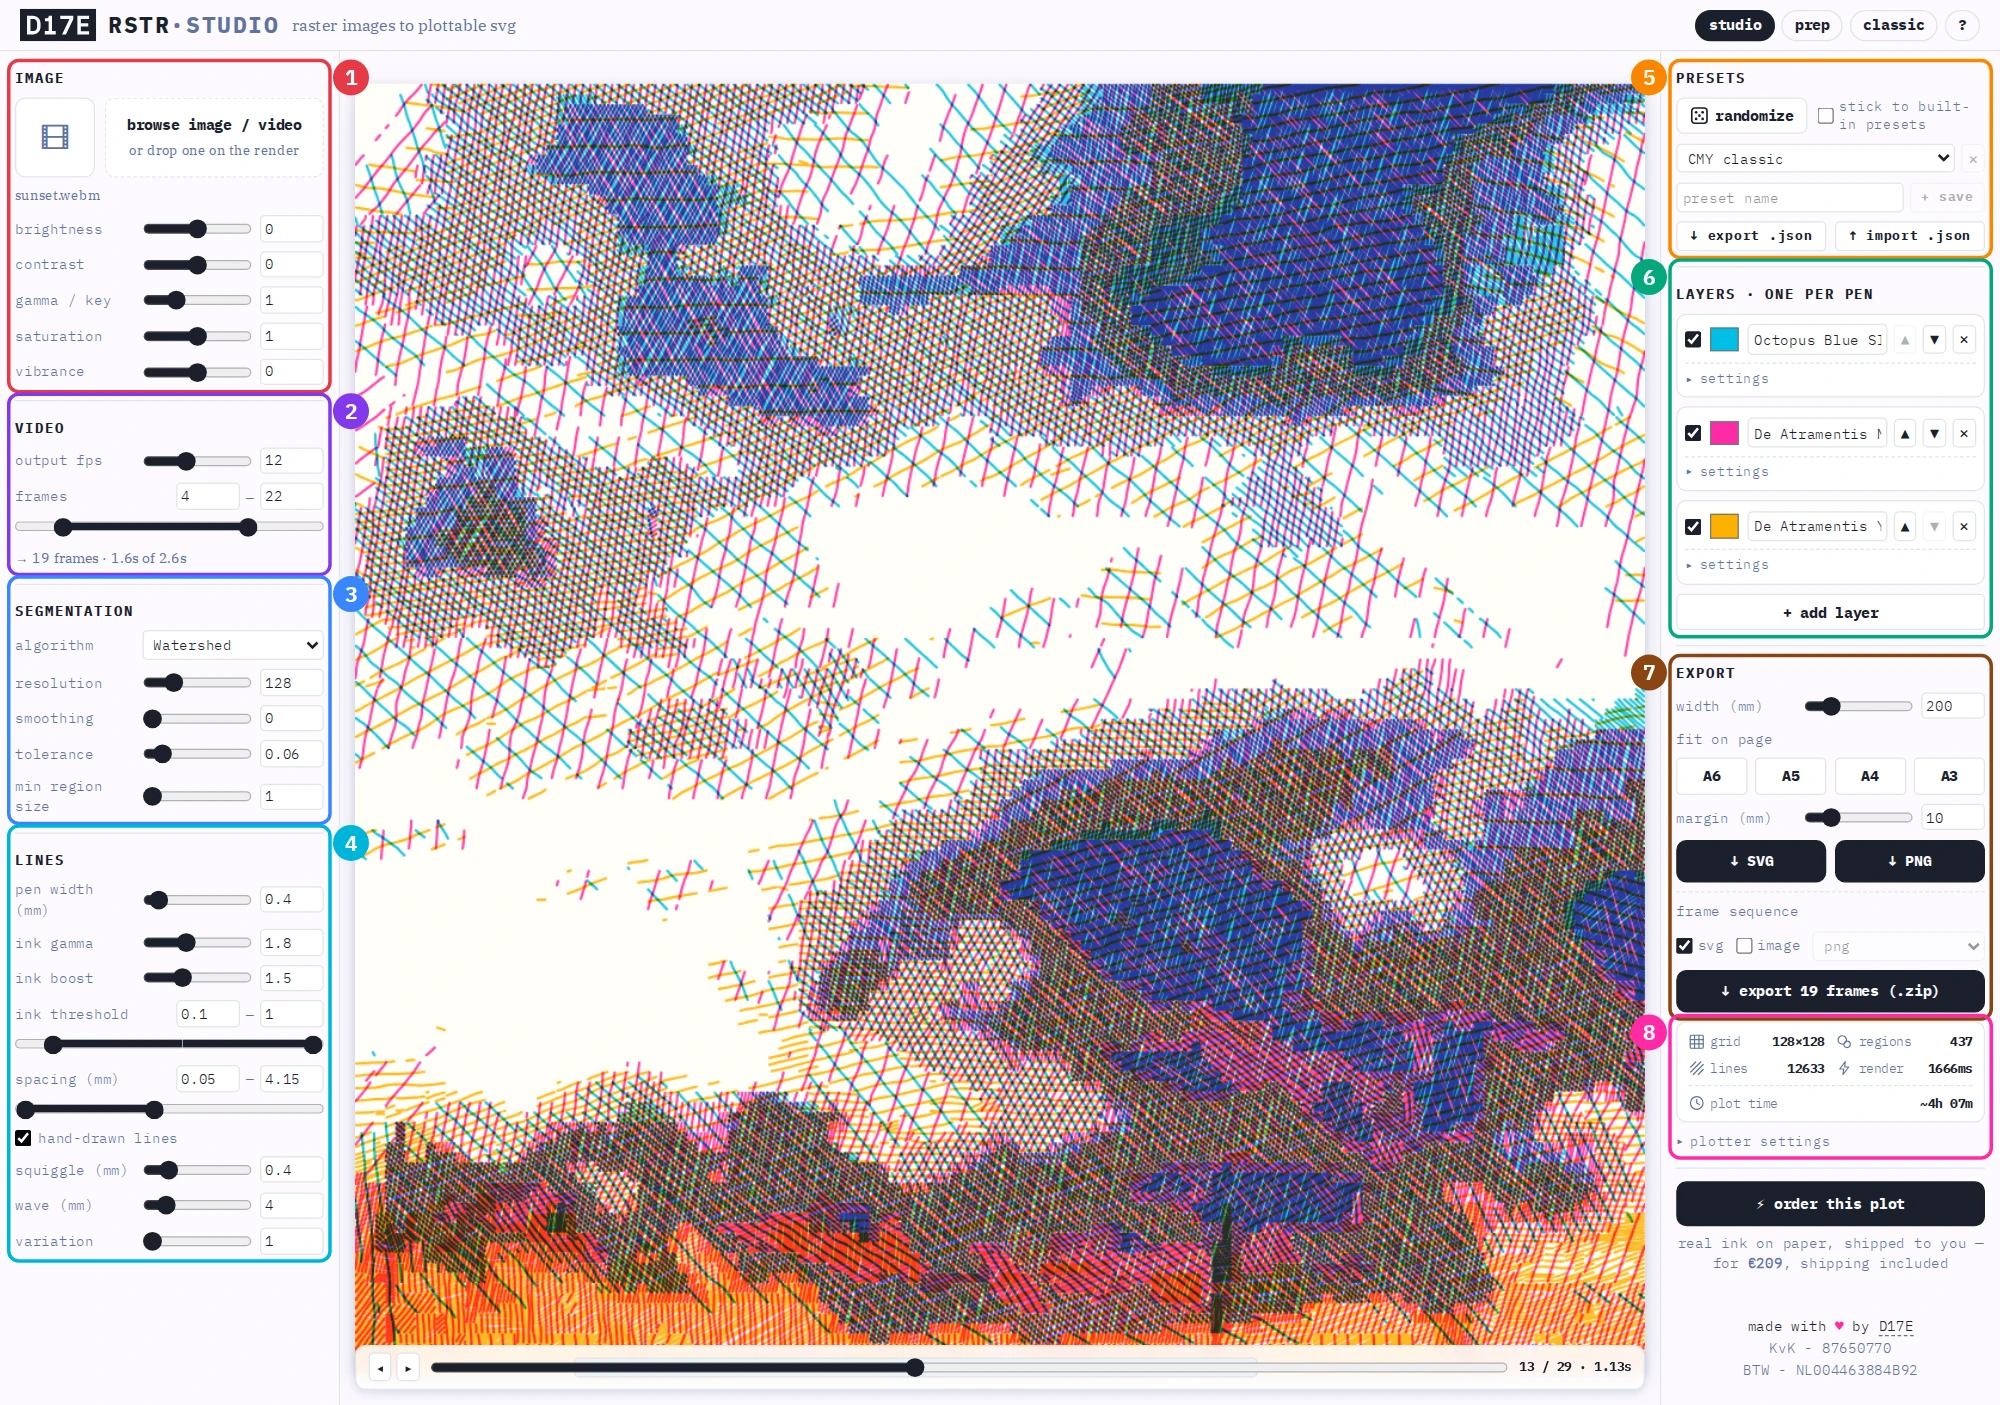
- 1 image: load a picture or video and tune it before tracing.
- 2 video: frame rate and export window, shown while a video is loaded.
- 3 segmentation: how the image is carved into tonal regions.
- 4 lines: pen width, how ink turns into line spacing, and the optional hand-drawn wobble.
- 5 presets: randomize everything, or save and share complete looks.
- 6 layers: one pen per layer, with its color, channel, hatch angles and overrides.
- 7 export: output width or a fixed page format, and the SVG, PNG and frame-sequence downloads.
- 8 stats: render numbers and the estimated plot time.
image
- browse / drop
- Load an image or video from your device, or drop it straight onto the render. Nothing is uploaded. It all runs in your browser.
- input thumbnail
- Hold it down to peek at the input with the adjustments below applied.
- crop / reposition
- Move the input around right on the render to zoom in on the interesting part. Drag to move it, scroll to zoom on the cursor (a trackpad pinch works too), alt/⌥ + scroll to rotate. On a touch screen, drag, pinch and twist with two fingers, while one finger keeps scrolling the page. While you reframe, the input gets a composition grid and an accent border along its own edge, so you can see where it ends even on a white background. Let go and the lines recompute for the new framing, which carries into every export (a video keeps one framing across all its frames). Double-click the render, or the ⛶ full image chip that appears, to get the whole picture back.
- brightness / contrast
- Brighten or darken the image, and push contrast around mid grey, before segmentation.
- gamma / key
- Midtone curve. Above 1 lifts the midtones, below 1 keys them down.
- saturation
- Uniform color saturation; 0 turns the input greyscale.
- vibrance
- Saturation boost weighted towards muted colors, so it won't blow out what's already vivid.
video
- supported formats
- Whatever your browser can decode. MP4 (H.264) and WebM play everywhere. HEVC (H.265) videos,
like the .mov recordings phones make, don't decode in many browsers, and the studio tells
you when that happens. Convert those to MP4 (H.264) first with QuickTime's export, HandBrake, or
ffmpeg -i input.mov -c:v libx264 -pix_fmt yuv420p output.mp4, then load the result. - output fps
- Frame rate the video is sampled at. Fewer frames per second means fewer, smaller files.
- frames
- The exported frame window (first – last). The timeline over the render shades this range; scrub it or step frame by frame to preview any moment with the current settings.
- frame sequence export
- Renders every frame in the window and downloads one zip: plottable SVGs, images (png, jpeg or webp with quality and scale controls), or both.
segmentation
Segmentation carves the image into regions of similar tone. Those regions are the shapes the lines fill.
- algorithm
- Watershed follows tonal basins, posterize bands intensities, k-means clusters them, and SLIC carves compact superpixels.
- resolution
- Grid resolution the image is sampled at. More cells means more detail and slower renders.
- smoothing
- Blur passes before segmentation. Higher means fewer, larger regions.
- superpixel size / compactness
- SLIC only: superpixel spacing in grid cells, and how strictly they stay grid-like versus following image detail.
- tolerance
- Maximum intensity difference for merging adjacent regions.
- min region size
- Regions with fewer cells merge into a neighbour.
lines
- pen width (mm)
- Physical line width used for rendering and spacing math. Layers can override it.
- ink gamma
- Perceptual weight on ink intensity before it becomes line spacing.
- ink boost
- Coverage multiplier. Above 1 pushes dark regions into overlapping lines.
- ink threshold
- The band of ink a region must fall in to be hatched. The low bound works as a high-pass filter, so regions holding less ink stay empty. The high bound is a low-pass filter, so regions holding more ink stay empty too (leave it at 1 to keep every dark region). Narrow the band from both ends to isolate the midtones.
- spacing (mm)
- Nominal min–max line spacing. Each region lands somewhere in this range based on its ink: dense lines where the image is dark, sparse where it's light.
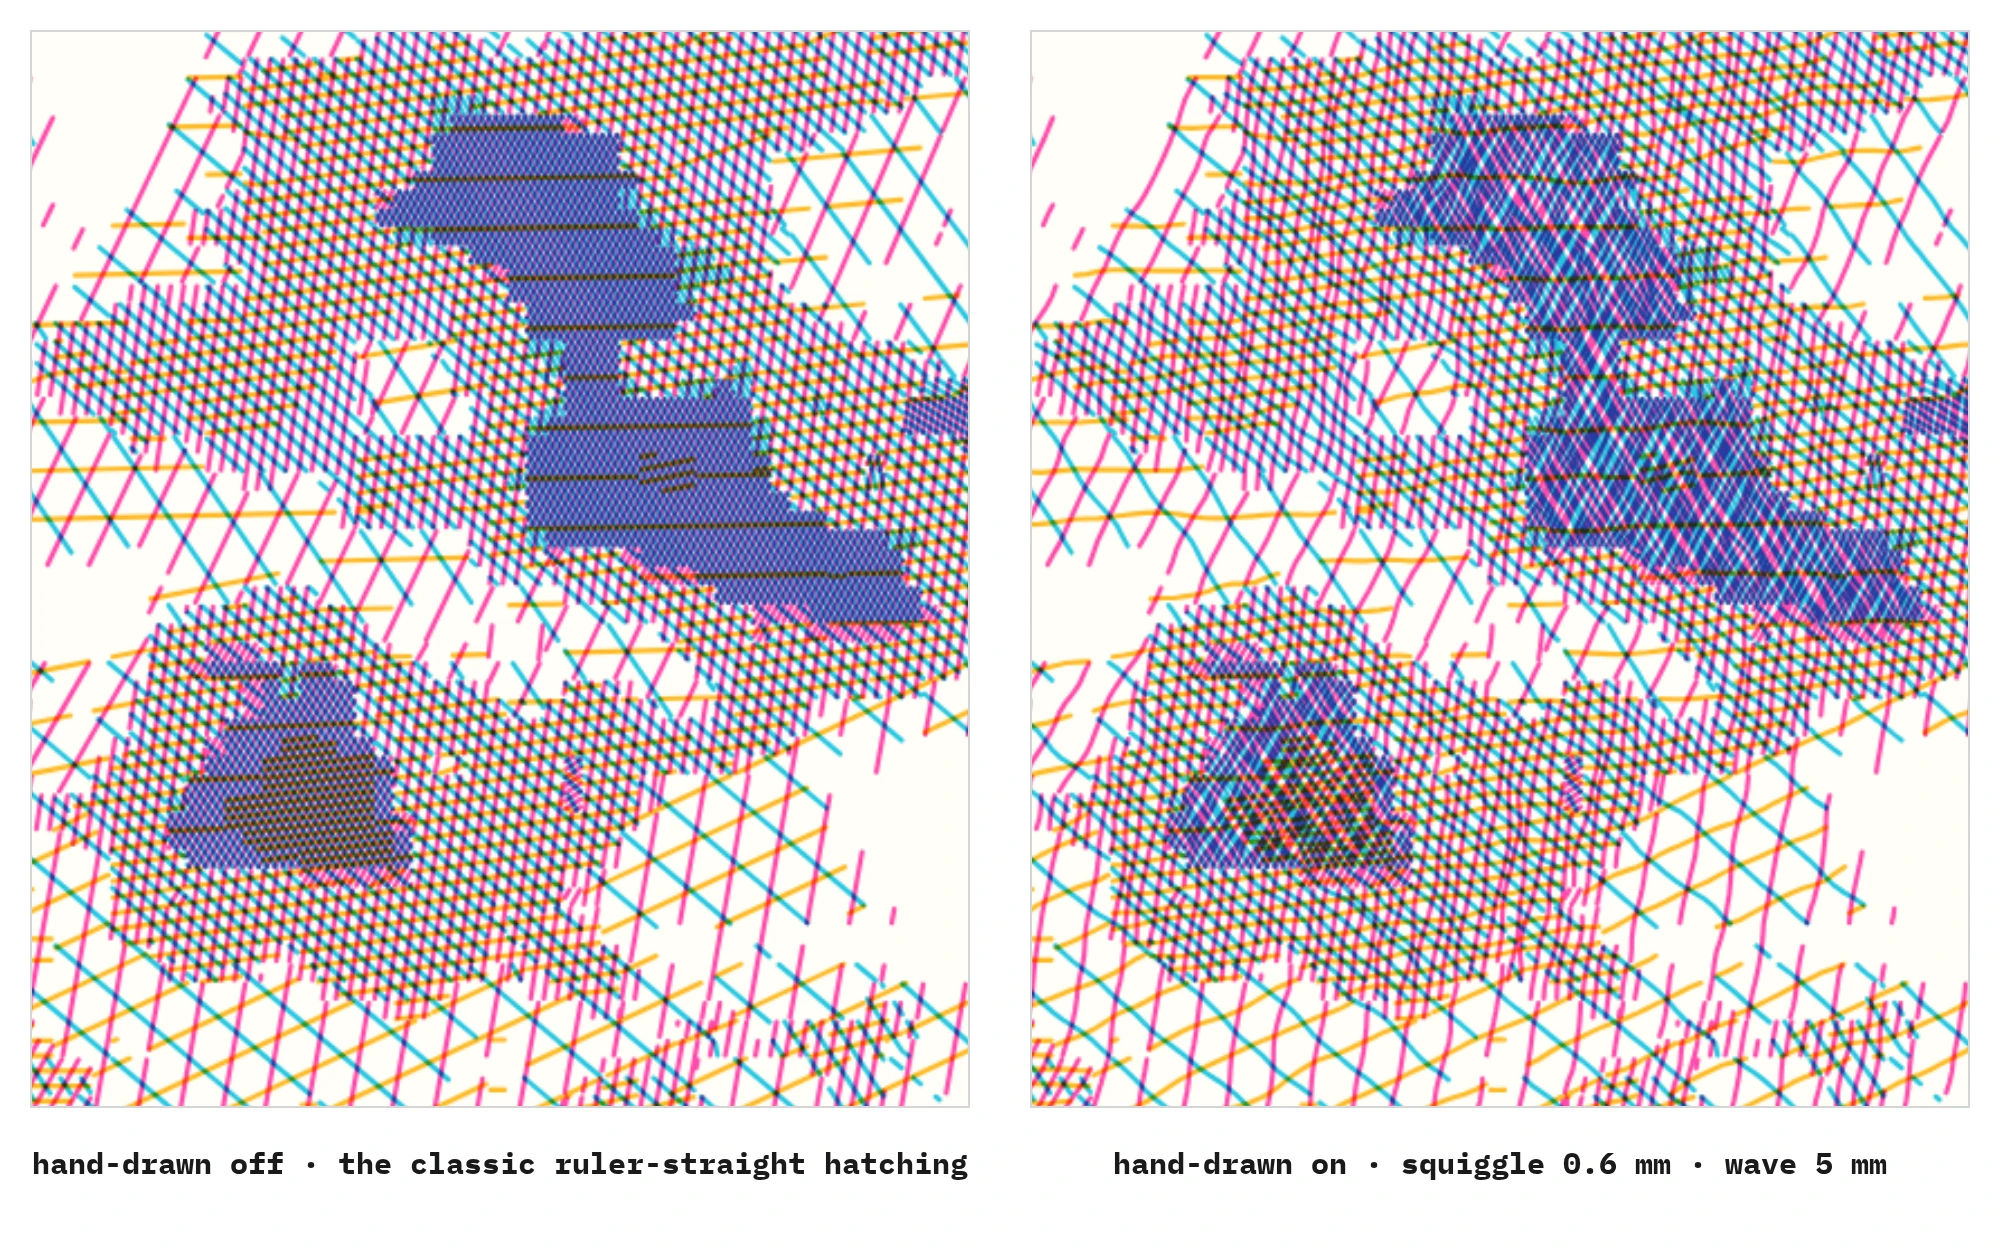
- hand-drawn lines
- Swap the perfectly straight hatch lines for organic, hand-drawn-looking ones. Off by default, and off means untouched. The classic ruler-straight output stays exactly as it was. Switch it on and the same wobble runs through everything: preview, SVG and PNG exports, frame sequences, and the plot-time estimate (squiggly lines are longer, so plots take a bit more time). The wobble is deterministic, so the same settings always draw the same squiggles.
- squiggle (mm)
- How far a line may wander from perfectly straight. Lines keep their exact endpoints, and short strokes stay steadier, so regions keep their shape.
- wave (mm)
- Distance between direction changes along a line. Short makes a nervous scribble, long makes lazy waves.
- variation
- Rerolls the wobble pattern without changing its character.
presets & randomize
- randomize
- The dice rolls all segmentation, lines and layer settings. "Stick to built-in presets" limits the roll to ink + pen combinations that physically exist, so the result stays plottable.
- presets
- Apply a built-in look, or save your current settings under a name. Saved presets live in your browser, and a fresh visit opens on a random built-in. Presets only carry the look. Your output width and margin stay yours (RSTR ignores any width or margin stored in older preset files).
- export / import .json
- Move settings between browsers or share them as a small JSON file.
layers, one per pen
- layer basics
- Each layer is one pen: pick its color, name it, toggle it, reorder with ▲▼ (layers draw top to bottom). The name becomes the layer label in the exported SVG.
- channel
- Which part of the image drives the layer's ink: cyan / magenta / yellow (the print channels), key / darkness, red / green / blue, or (inverted) luminance. "Match pen color" instead derives the channel from the layer's pen color.
- angle min / max
- Hatch direction range. Every region picks its own angle within it, based on the region's shape, so one layer never looks mechanical.
- overrides
- Pen width, the threshold band (low / high), spacing, ink gamma and ink boost can be set per layer. Empty fields inherit the global lines values (shown as grey italics); "clear overrides" resets them all.
export
- width (mm)
- Physical output width. The height follows the image aspect. This one is yours. Presets and the dice never touch it, and it stays put while you switch inputs.
- output format
- You can compose onto a fixed sheet instead. Toggle A6–A3 (tap again to turn off; at most one is active), or pick more sizes from the list: A2–A0, B-series, US letter/legal/tabloid, squares, AxiDraw beds and a custom width × height. The render takes the page's shape, the export becomes exactly that page, and the whole image starts fitted inside the margins. From there, crop and reposition it into the sheet with the usual gestures. Named sheets are turned to match the input (flip them with ⇄); a new input starts back at no format.
- margin (mm)
- With a format active, the margin works as a mask. RSTR keeps a band this wide around the sheet's edge clear of ink, whatever the composition puts there, like a matted print, and safe for the plotter's paper clamps. The reframing view dims the masked band while you compose. Defaults to 10mm; 0 disables the mask.
- ↓ SVG
- A plottable SVG with one layer group per pen, ready for plotter software.
- ↓ PNG
- The current render as an image, for screens, sharing and regular printing.
- ⚡ order this plot
- No plotter? I'll plot it for you. Real pens on paper, shipped flat-packed with tracking, shipping included in the price. Orders are limited to the inks in the built-in presets and sizes up to A3, and the order dialog tells you if a design needs adjusting. Your order carries only the exported SVG, the lines to draw. Your image stays on your device, and I use the SVG for nothing but making your plot.
stats & plot time
- grid / regions / lines / render
- The sampling grid size, how many tonal regions segmentation found, how many hatch lines it drew, and how long your browser needed to compute the render.
- plot time
- Estimated plotting time on an AxiDraw-style machine, using saxi's motion model: drawing, travel and pen lifts. Hover it for the per-pen breakdown.
- plotter settings
- The motion profile behind that estimate: pen-up/-down speeds and accelerations, cornering, pen lift/drop pauses and the join radius (the plotter draws lines closer together than this without lifting the pen). Match it to your machine, or reset to saxi's defaults.
prep
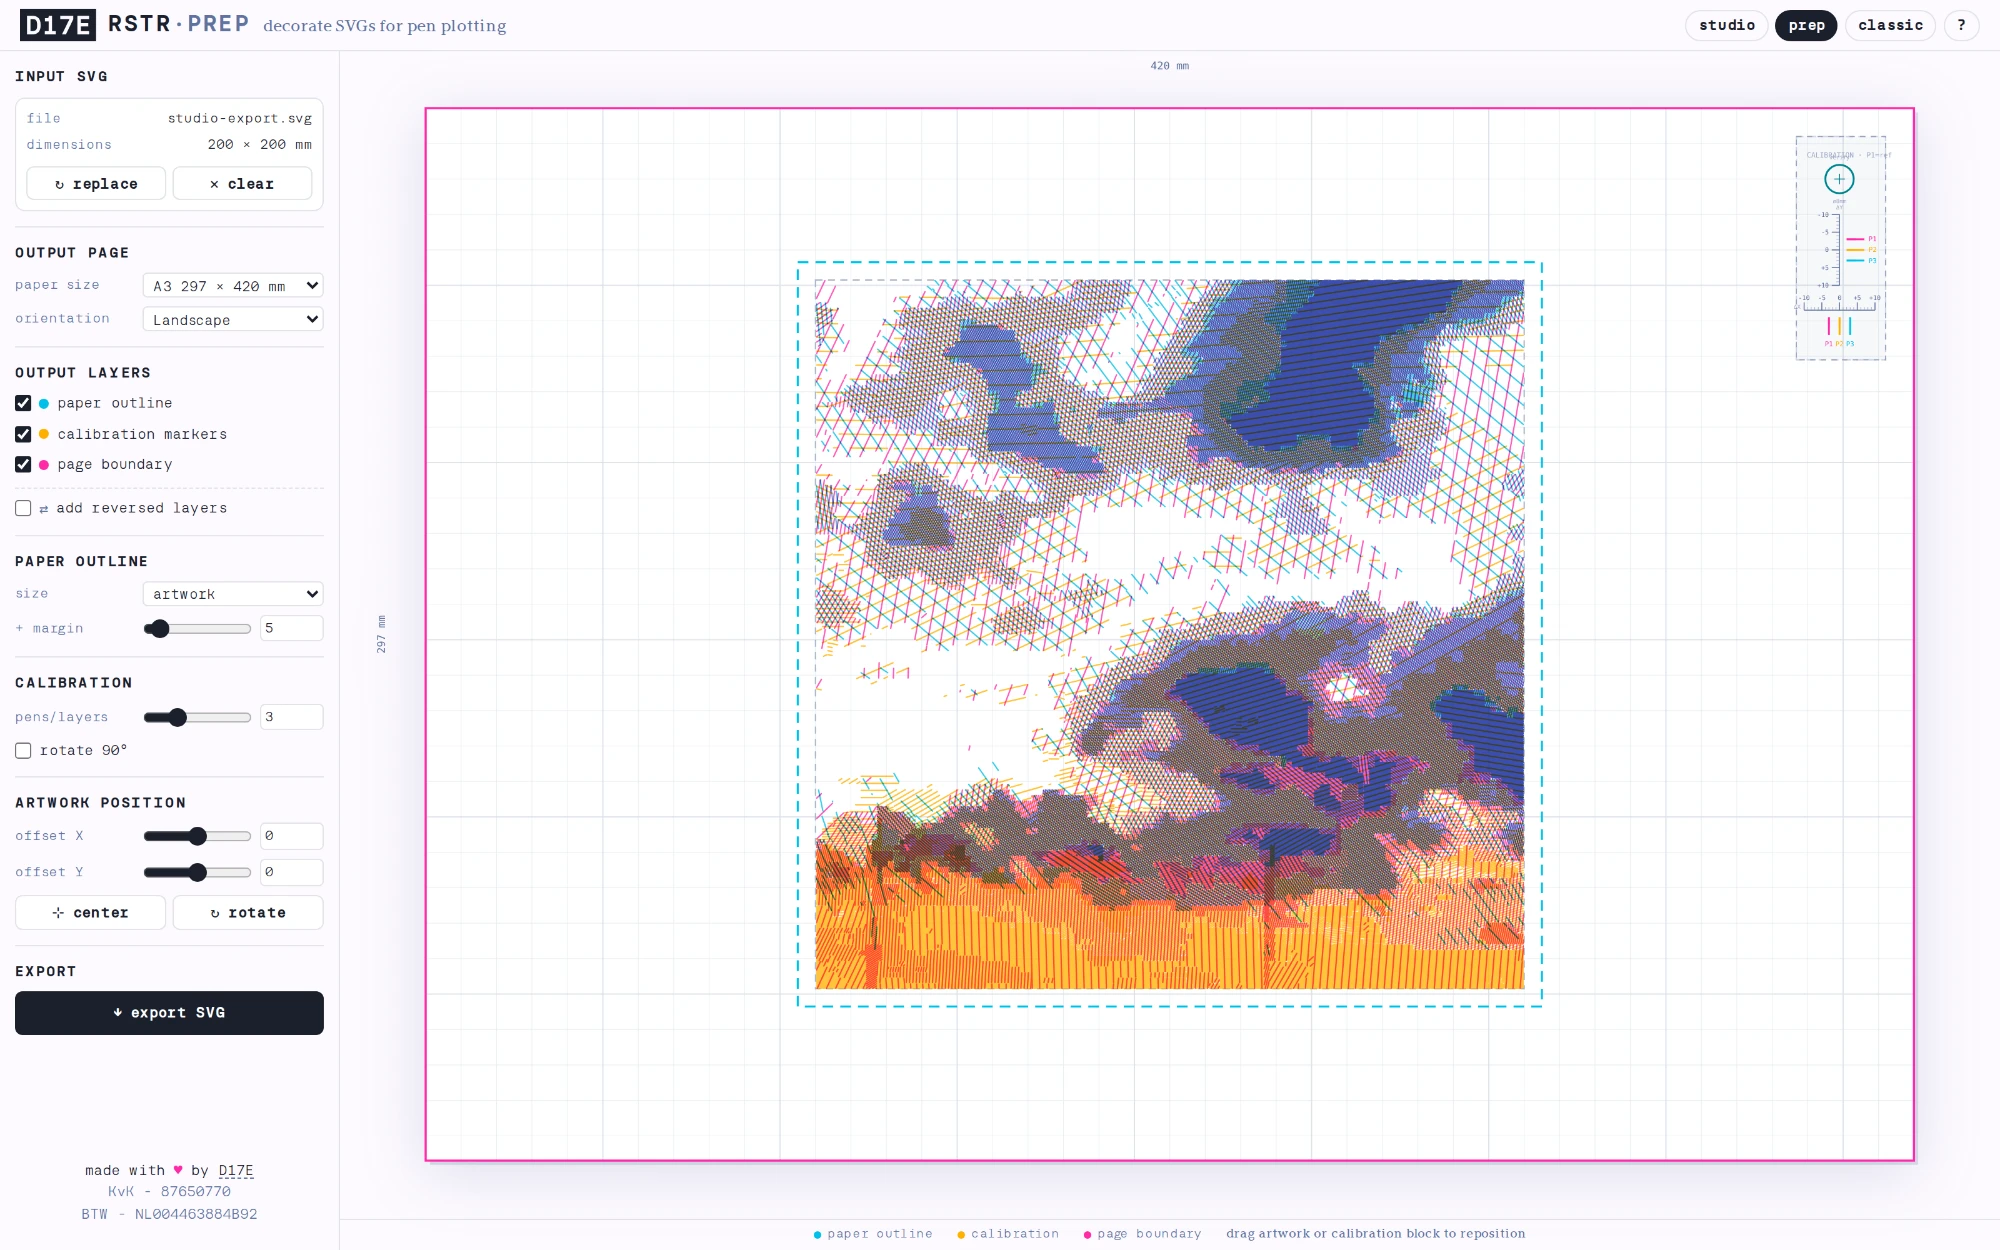
The plot prep tool at /prep takes an exported SVG and dresses it up for the machine.
- output page
- Pick the page size and orientation the plotter will see; drag the artwork (or use the offsets) to place it.
- multiple SVGs
- Drop several same-size SVGs, a folder, or the studio's frame-sequence zip (SVGs in the root
or an
svg/subfolder), which is what the video export produces. Prep lays the frames out as a grid with an adjustable per-frame margin, gap and edge clearance, across as many pages as it needs. It merges the matching layers of all frames so pen selection in saxi stays simple, and writes each frame's number in plottable single-stroke digits. Export downloads a zip with one page SVG per sheet. - paper outline
- Marks where to place the physical paper. Size it to the artwork (or to each frame) or to a fixed format, add a margin, and draw it as a full rectangle, corner marks or crosses.
- calibration markers
- Rulers, a verify circle and one line pair per pen, so multi-pen plots line up. Drag the block anywhere.
- page boundary
- A rectangle around the full output page.
- frame template file
- Multi-frame exports only. Adds a
…_frame-template.svgto the zip: page 1 with oneframe-Nrectangle per grid cell, numbered row by row in animation order. Load it as the template in Framesheet Studio together with photos of the plotted pages, and it turns them back into a looping animation. It is not a plot file, so keep it out of the plotter queue. - add reversed layers
- Duplicates every artwork layer with the same lines running in the opposite direction, so each line gets plotted twice for denser ink. Works on the studio's hand-drawn wobbly lines too: every squiggle is retraced point for point, just backwards.
- export SVG
- Downloads the decorated SVG with everything on its own (Inkscape-compatible) layer.
classic
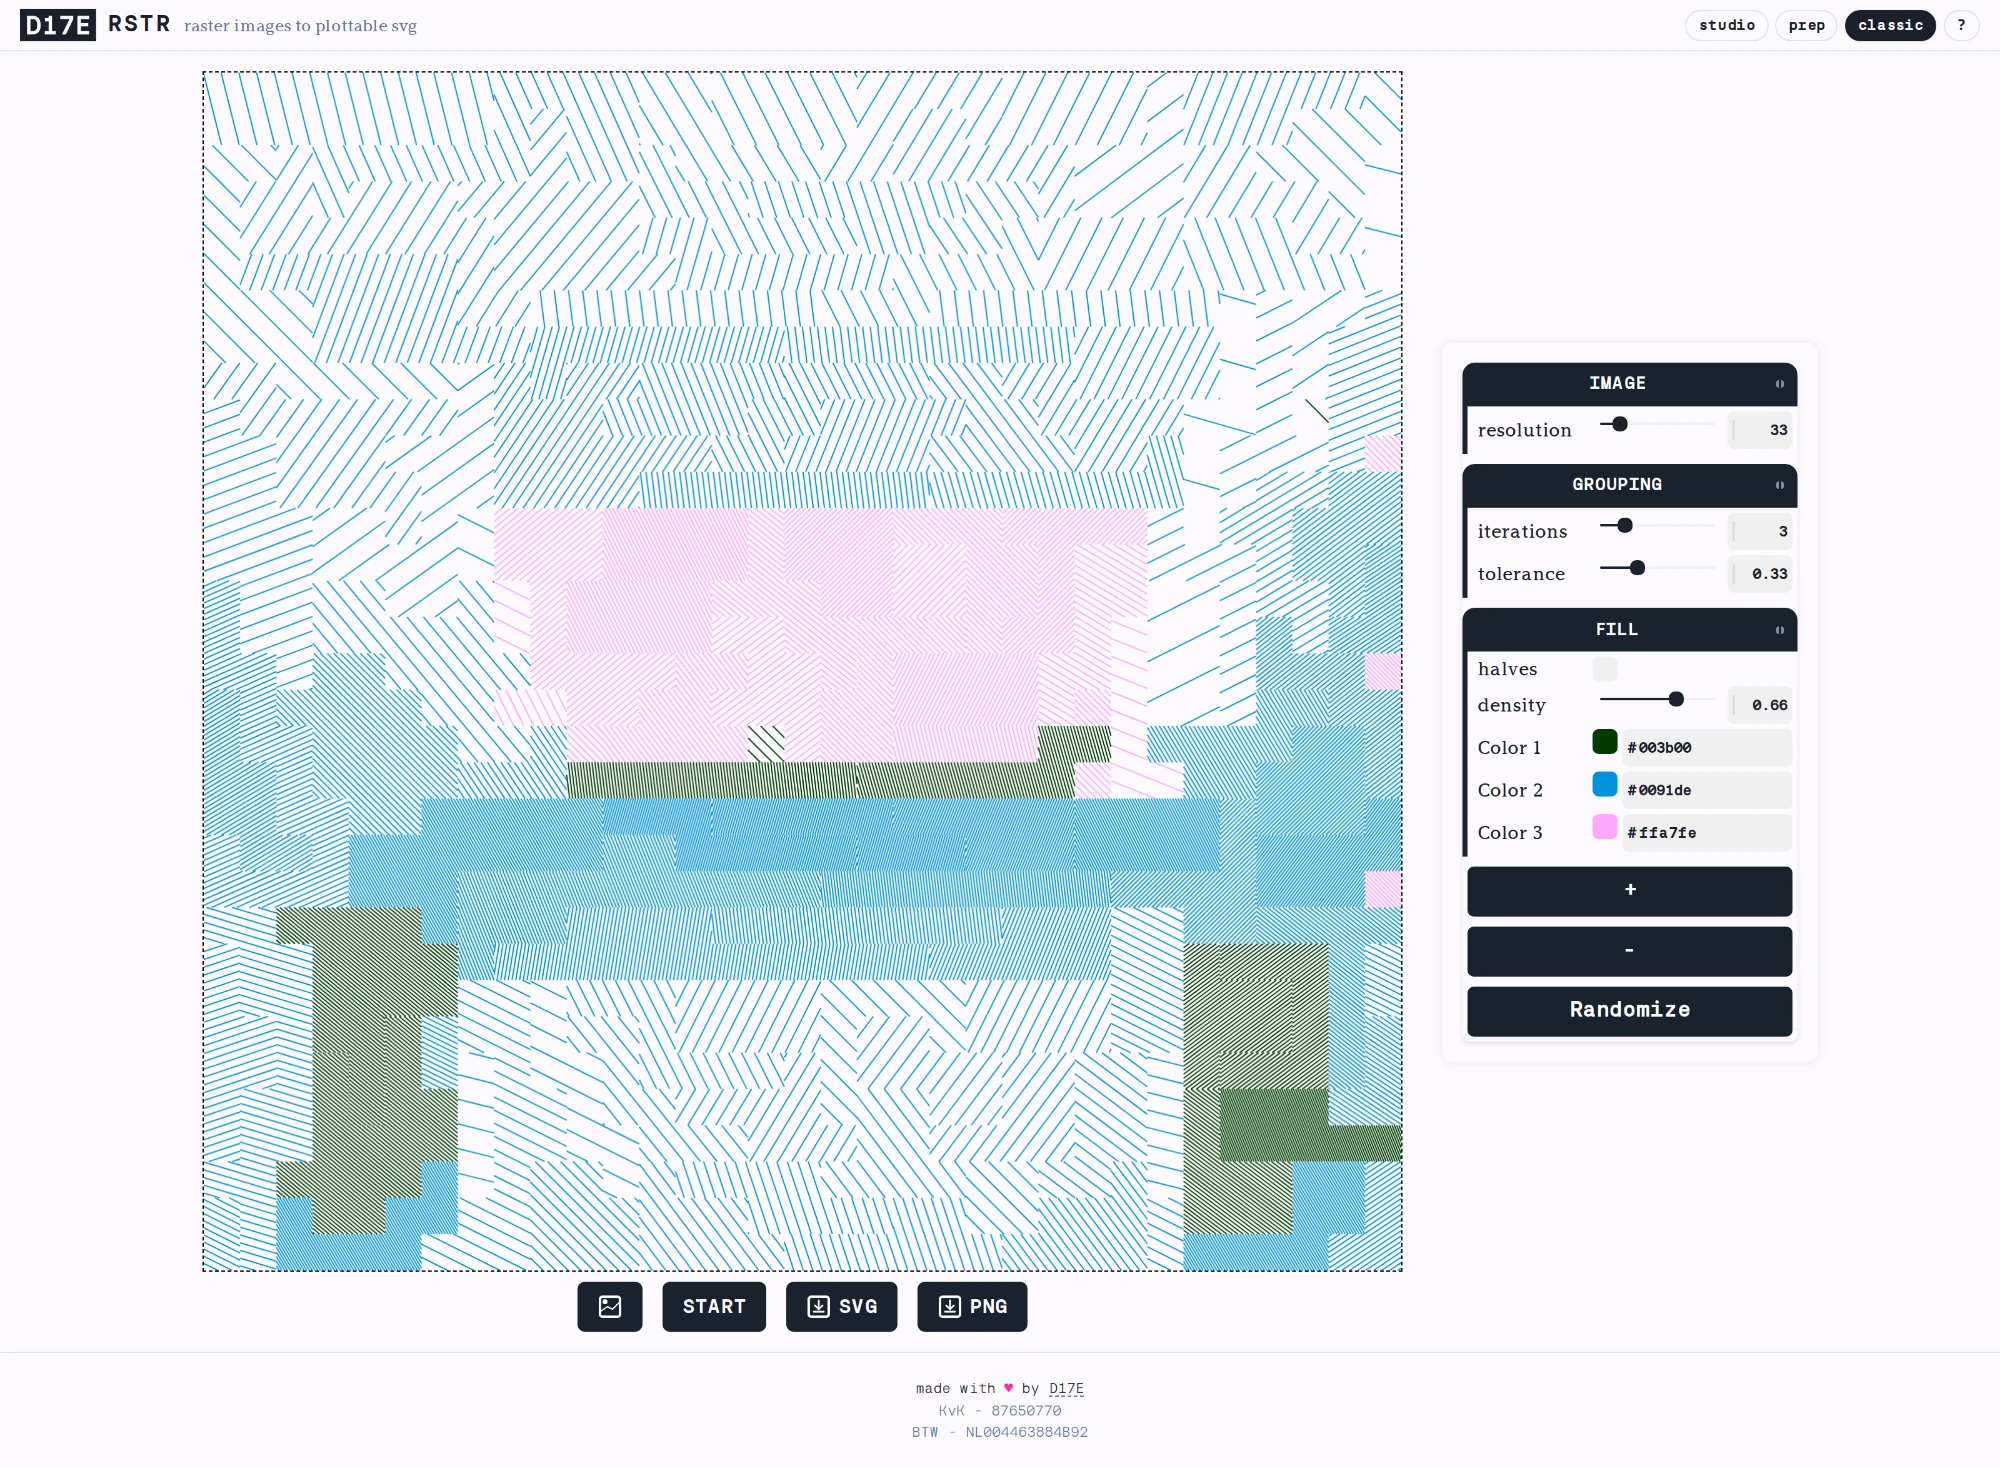
The original RSTR lives on at /classic, kept around for nostalgia and because it still makes nice plots. One image, one layer, multiple pens. The algorithm that started all this.
good to know
- private by design
- Images, videos and settings never leave your device. There is one deliberate exception. Ordering a plot sends the exported SVG along with your order: the lines to draw, never your image. I use it for nothing but making that plot.
- works offline
- RSTR is an installable web app. Once you've visited it, it keeps working without a connection.
- settings persistence
- This browser remembers your settings from the moment you first edit one. Until then, every visit rolls a fresh random preset.
- real ink colors
- The palettes behind the randomize button come from real fountain-pen inks, so a random roll always lands on colors you can plot with. They follow the ranges from De Atramentis, Octopus Fluids and Rohrer & Klingner.